英语作文:图表作文数据对比
2020-01-13 03:02:02 656
方向:
根据以下图表撰写论文,其中您应
1)解释图表,以及
2)发表您的评论。
您应该在答题纸2上至少写150个字。

高分范文
◆◆
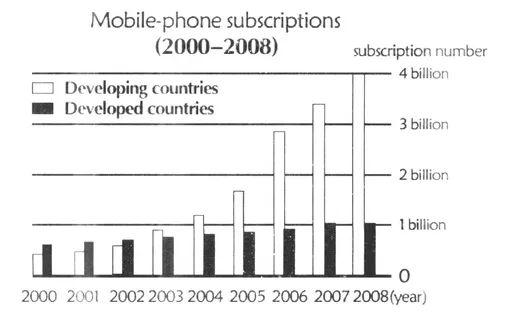
条形图显示了2000年至2008年间发展中国家和发达国家的移动亚离子数量。在此期间, 发展中国家的移动用户数量急剧增加,从4亿增加到大约40亿,而发达国家的变化(从6亿增加到10亿)很少。
原因很明显。在过去十年中,大多数发展中国家见证了快速的全球发展。公民比十年前富裕得多,能够负担得起手机的费用。相比之下,发达国家的经济增长缓慢,许多人在2000年已经拥有手机,so number of mobile subions re is less likely to have a distinct rise.
Anor reason is that population of developing countries in total is larger than that of developed countries, and number of potential mobile subscribers is higher. So when people, be ey from developing or developed nations, want to subscribe to mobile phone services, those from developing countries will definitely contribute more to higher total number of mobile subions.
◆◆
参考译文
◆◆
这幅条形图展示了在2000年到2008年间发展中国家和发达国家的手机用户数量。在此期间,发展中国家的手机用户数量已大幅增加,从4亿増加到40亿,而发达国家的变化(从6亿到10亿)则相当小。
原因显而易见。过去十年间,全球大多数发展中国家快速发展,人民比十年前富裕得多,因而能够负担得起手机。相比之下,发达国家的经济增长缓慢,那里的许多人在2000年已经拥有手机,所以手机用户的数量不太可能有明显的上升。
◆◆
好词好组
◆◆
During this period, number of something has seen a dramatic increase:
在此期间,某事物的数量已大幅增加
The past decade has witnessed……:过去十年(发生了)……
dramatic adj. 突如其来的;急剧的
witness vt. 见证;经历(事件、变化等)
distinct a.显着的;明显的
potential adj潜在的;可能的
by contrast相比之下
▍ 来源:综合网络


